
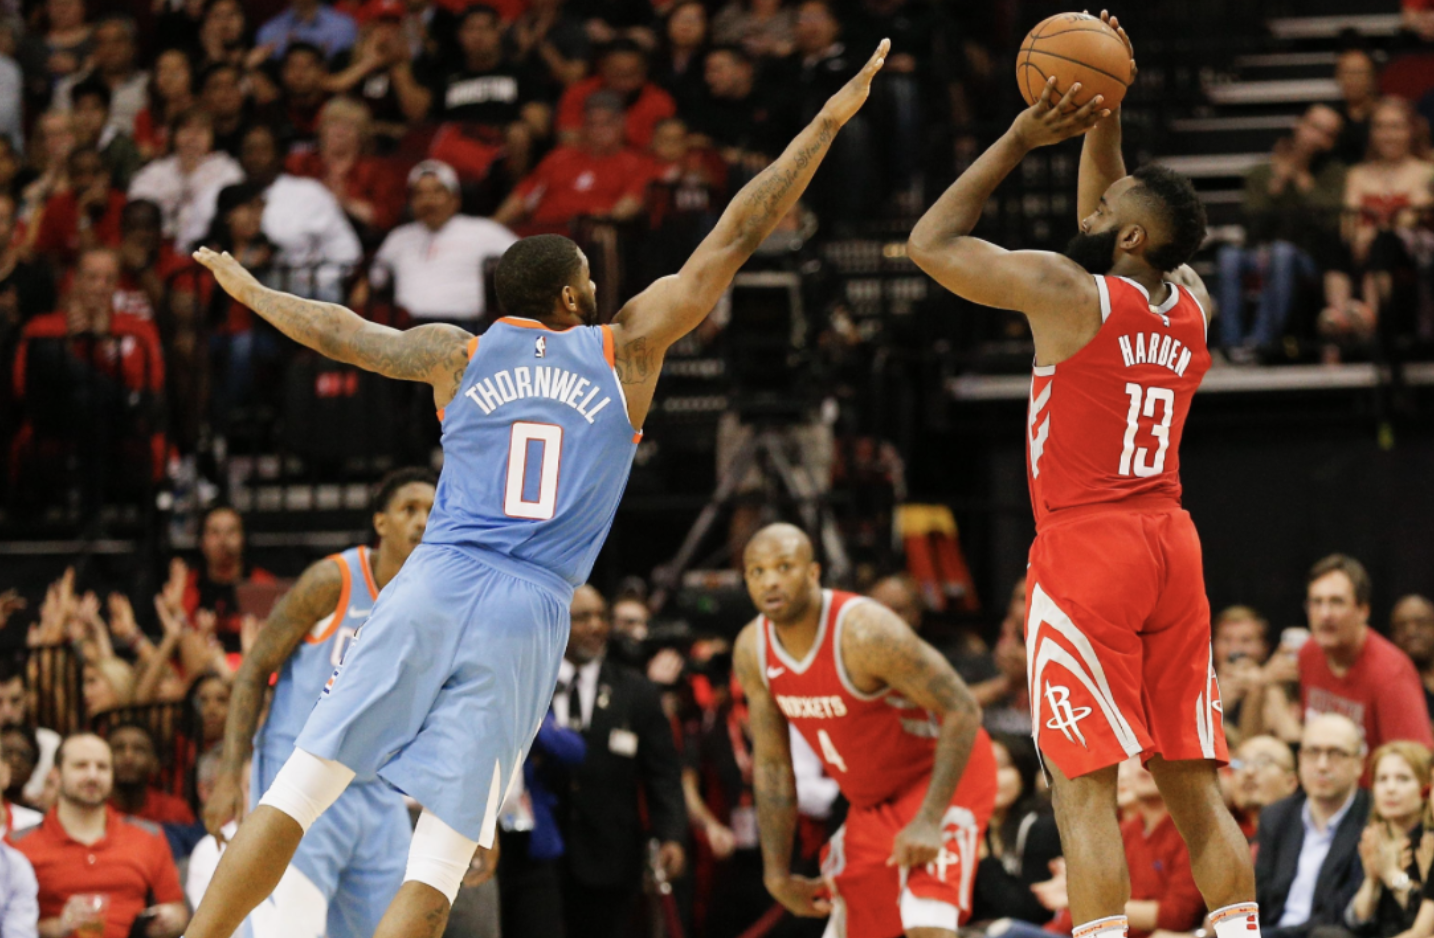
From 2013 through 2020, the Houston Rockets NBA team took 26% of their shots from midrange, by far the lowest percentage of mid-range shots taken in the NBA over that span. This tactic, as insignificant and trivial as it may seem, represents a concept that changed how basketball was played.
Led by the 2018 league MVP, James Harden, and the genius mind of Rockets’ general manager, Daryl Morey, the Rockets’ style of play focused on solely taking three point shots and shots near the rim. While the Rockets only took 26% of its shots from the midrange (which is defined as the area outside of three feet from the rim but inside the three point line), they took a league leading 43% of their shots from beyond the three point line (8% more than the second highest team over that span) and 31% of their shots from within three feet of the rim.
This style of play was called Moreyball, a combination of Houston’s general manager’s name and “Moneyball,” the hit movie about the Oakland Athletics using a revolutionary data driven approach to exceed expectations. The name was fitting; Houston used analytics to an extent never seen before in basketball.
“The goal of analytics is to try to make sense of uncertainty,” says Fieldston math teacher Mr. Chu. “There is so much chance involved in every interaction in sports that you are basically trying to quantify that uncertainty to give you a likelihood of what will work best. What analytics allow you to say is something more than ‘I don’t know’.” Morey, who worked in basketball analytics before his job as general manager, found that the midrange shot was the least efficient shot in basketball. In the 2018 season, the average points per possession for an NBA team was 1.10. In other words, the total number of points divided by the total number of possessions was 1.10. The points per shot for a midrange was 0.81. Meanwhile, the points per shot for a three-pointer was 1.06, the points per shot for shots at the rim was 1.26 and the average points from two free throws was 1.53 points. Therefore, the three shot types Morey prioritized were three pointers, shots close to the rim and free throws.
In the regular season, this strategy worked very well. During the 2016-17 and 2017-18 regular seasons, Houston had two of the best offensive seasons in NBA history, respectively, posting the tenth and eleventh best offensive efficiencies ever. But in the eight season span, the Rockets underachieved in the playoffs. They only reached the Western Conference Finals two times and never made it to the finals.
Their most embarrassing playoff moment came during Game Seven of the 2017-2018 Western Conference Finals against the Golden State Warriors. After a close series, the Rockets managed to blow a double digit lead. They missed 27 consecutive 3 point attempts. This feat is nearly impossible. According to a computer program by FiveThirtyEight, the likelihood of a team missing 27 threes in a row is 1 in 72,000.
Analytics clearly couldn’t predict the events of that game, as the numbers couldn’t account for the Rockets bad shot selection from beyond the arc, the fatigue from a long seven game series, or the frustration players experience when they can’t get a shot to drop. The numbers also couldn’t account for the impact the injury of future Hall of Famer and midrange savant Chris Paul had on the shot selection and quality of shots taken for the Rockets.
The Rockets are the prime example of the debate within the sports community about how effective analytics can be. On one hand, analytics were clearly a reason that the Rockets had been so successful. But on the other hand, the Rockets’ use of analytics potentially contributed to their downfall, as they focused too much on the numbers and not enough on the game itself.
When I interviewed Mr. Marro in October, this debate was fleshed out. Mr. Marro argued that too much of an emphasis on analytics can hurt a team. “If you don’t take into account the human piece (of a sport), you’re not going to do well,” he said. Mr. Marro used the example of the Yankees entering the playoffs. He explained that a number of additional factors emerge when a team enters the playoffs. “Is (a playoff game) the same as a July game against the Mets at two o’clock on a Thursday? No.” Therefore, he argued, if you use the same analytics based strategy that you used in the regular season in the playoffs, you will have much less success.
At this point, Mr. Drybala, who had been listening from the doorway, walked into the room. “I disagree with that because all analytics is really suggesting is the probability of an event occurring,” he intervened. Analytics is based on probability, and probability depends on sample size. Because there are fewer games in the playoffs, it is more difficult to predict the winner. However, analytics can still show a team what is most likely to help them win.
Ultimately, Mr. Drybala’s point is more widely accepted. I spoke with Professor Mark Broadie, the Carson Family Professor of Business and Vice Dean at the Columbia Business School. Dr. Broadie is well known in the golf community as the creator of the “strokes gained” statistic. “I haven’t found any convincing research that says teams play differently in a playoff game than a regular season game.” But Mr. Marro still raises an important point. There are a lot of important factors of a game that can’t be reflected in analytics.
Teams have always used statistics to get an advantage over opponents, no matter how small the advantage is. The limitation has always been the available data. At first, teams only had access to traditional statistics, such as how many shots a player makes or how many tackles a player has. Over time, as computer programming became more popular, teams began to plug statistics into computers, creating calculations such as points per shot and expected points added per play.
In football and basketball, some teams rely on analytics more than others. As football journalist and analyst Mark Bullock, who covers the Washington Football Team, told me, “The younger coaches and general managers that are getting jobs will have grown up with (advanced) analytics, so they’re going to get used more and more as the next generation of coaches and GMs take over.” Many older coaches shy away from analytics, trusting their instincts over numbers. Take fourth down decision making in football. Although oftentimes analytics predict a team will have a better chance of winning if they go for it on fourth down, some coaches are hesitant to make this decision.
Despite widespread hesitancy, the field of analytics is still growing. As Dr. Broadie said, “There has been a visible, observable, quantifiable change in probably every major sport. It used to be that few baseball teams had analytics rooms, now every team has an analytics room. It used to be the same for basketball, now every basketball team has an analytics room. Every football team. Every hockey team. Every soccer team. It didn’t use to be that way and now every team realizes the value (of analytics).”
Currently, analytics can be used in all aspects of football and basketball. In the draft process, analytics can determine which players are most likely to succeed. In free agency, analytics can determine how much different players are worth and can improve roster development. In games, analytics help determine how to attack and defend teams and specific players. Finally, analytics can help prevent injuries by determining when a player should practice and play.
As it is clearly an imperfect system, sports analytics has significant room to grow. There is still a sizable gap between analytics and on field activity. Tracking technology, which can be used to track the ball and players’ movement in a game, will help close this gap.
In the NBA, tracking data is done by Second Spectrum. Although established in 2013, Second Spectrum started tracking NBA games in the 2017-18 season, using numerous cameras placed around the stadium. Their 3D data is then entered into a computer program, which converts the player and ball movement into statistics and analysis.
With Second Spectrum, NBA plays can be understood like never before. A good example of this is with shooting. Before tracking technology, the best a team could quantify a players’ shooting was through stats such as true shooting percentage, which essentially is a shooting percentage that takes into account the added value of a three point shot (a made three point shot is worth 50% more than a made two point shot). Second Spectrums’ tracking technology compares the odds of a specific player making a given shot, taking into account how contested the shot is, to the average player making that same shot. This gives teams a much better understanding of a player’s shooting ability by taking into account the difficulty of the shots they take.
In the NFL, tracking technology is made by Zebra Technologies, which partnered with the NFL in 2014. By 2017, it had RFID chips on all players and in footballs. Zebra provides data for every NFL game and is also partnered with around one-third of the NFL teams to provide data for practices. Zebra can provide information about nearly everything that occurs on the football field, from a player’s movement and speed to the speed and rotations per minute of the football to the separation a receiver creates on his route. Brett Kollmann, a film analyst who hosts the Youtube channel “The Film Room” for his 310,000 subscribers, says the tracking technology “can help track acceleration, pursuit angles, tackle rates, pass rush angles, and a whole myriad of other things that traditional data can’t even come close to.”
Although all of this information is available, teams still have a lot of work to do to put this data to good use. I spoke with NFL analyst Tej Seth, an intern at the football data and analytics company Pro Football Focus. Seth explained some future applications for NFL teams of the tracking data, saying, “Once NFL teams get a good grasp of it they’ll use it for making roster decisions, the draft (once college tracking data becomes a bigger thing), and deciding who to start.”
Seth elaborated on how tracking data can be used in the draft process. “Tracking data takes out a lot of the biases that scouts have,” he explained, “Scouts will fall in love with players because of traits but tracking data will just show the numbers.” When scouting a prospect, scouts can only go into so much depth as “He has a good spiral” or “He has a strong arm”. Tracking data will improve the analysis of players in both football and basketball, using objective data, such as how many rotations per minute a quarterback can throw the ball at, instead of subjective statements.
Tracking data is also used in practices to prevent injuries by tracking how much work a player has done at practice, whether it be how many footballs he has thrown, how many shots he has taken, or how many miles he has run. Using this data, teams can decide when to rest their players to ensure they stay healthy. The data can also be used at practices to determine the skill level of a player. For instance, technology in basketball can determine how good of a shooter a player is after only one or two shot attempts.
Overall, tracking data will revolutionize the data available to professional sports teams. All of this new data can be used in everything a team does, from drafting, to player development, to roster design, to practice regiments, to game plans. The data allows analysts to represent almost everything that occurs in a sport through data and numbers, and significantly closes the gap between analytics and on field performance.
“There is a worry that all these numbers take the fun out of sports,” said Dr. Broadie, “But I think just the opposite. I think it shines a light where there was no light before. Like there is this dark room and things happen and you’re not really sure what happens. You know who wins but you don’t necessarily know why. You don’t know what the contributing factors were. … what analytics does is shine a light on the why behind an outcome. That makes sports more interesting, not only for the players to help make them better and the teams to find better players, but also for the fans to better understand what’s important.”